


mirjam.nz
Bronze Partner
- Joined
- Dec 6, 2010
- Messages
- 80
- Reaction score
- 23
Hi all
I downloaded "Grafana Big Query Default" and installed the Grafana *.json reports but found conflicting results compared to the web-based switchboard wallboard.
In the Grafana template 03. Queues, the number of answered calls does not match the results from the report "Detailed Queue Statistics".
However, in the Grafana dashboard, it only shows 17 answered calls in total instead of 19 as per .

Additionally, under the section "All Queues [Totals]", the figures for calls received and calls not answered are completely out of proportion:
The date range is set to Today Refresh on 10 sec

Has anyone else noticed inconsistencies with these reports?
Thanks
Miriam
I downloaded "Grafana Big Query Default" and installed the Grafana *.json reports but found conflicting results compared to the web-based switchboard wallboard.
In the Grafana template 03. Queues, the number of answered calls does not match the results from the report "Detailed Queue Statistics".
| Queue | Total Calls | Abandoned Calls | Answered Calls | Answered % | Serviced Callbacks | Total Talking | Mean Talking |
|---|---|---|---|---|---|---|---|
| 904 - C | 3 | 0 | 3 | 100% | 0 | 00:04:46 | 00:01:35 |
| 901 - L | 16 | 0 | 16 | 100% | 0 | 00:40:11 | 00:02:30 |
However, in the Grafana dashboard, it only shows 17 answered calls in total instead of 19 as per .
Additionally, under the section "All Queues [Totals]", the figures for calls received and calls not answered are completely out of proportion:
- Calls received: 245
- Calls not answered: 228
- Calls answered: 17
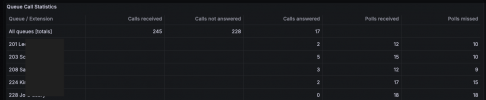
The date range is set to Today Refresh on 10 sec
Has anyone else noticed inconsistencies with these reports?
Thanks
Miriam
Last edited:


