Call Data Record [CDR] collection, analysis & reporting package + Simultaneous Call Chart

Status
Not open for further replies.

Cjay

Free User
Joined
Feb 24, 2007
Messages
322
Reaction score
67
There is an update available to my CDR analysis package which was originally documented here and which I know some people are using. This new version corrects a couple of issues that unfortunately crept into the previous version...! Along with all the previous features, this new release also has the capability to chart simultaneous calls / trunk utilisation. The documentation & software can be found here
I hope you find it useful!
11280
 
We don't have a need for this type of reporting right now but bravo for creating it and posting it for people to use. The documentation looks good and seems simple enough to use.
 
Well done @Cjay I'll try it as soon as possible ;)

Mathieu
 
Anybody that is sitting back and wondering about this program, TRY IT, and I believe you will be impressed at how powerful and well crafted it is. I am on the second full day now and I'm anxious to see what it will be like after a full week, or four weeks even.

@Cjay, you have plenty to be proud of with this program. Suggestion: on the main screen, below the "Trunk Billing Status" and above the "Toolbox" you have an open section of the window. How about populating the section with an interactive graph? Maybe one that cycles through various volume graphs such as # of calls today vs yesterday, this week vs last week, etc?
 
Hello @dkirk-ads, thank you for your comments!

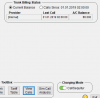
The 'space' that you mention is actually where the 'Trunk Billing Status' section can dynamically expand downwards into depending on how many trunks you have set-up in your system. So in my 3CX system I have 4 trunks configured, the maximum number that can be displayed is 10, at which point there is virtually no free window space left [though you can still have more than 10 trunks on your system should you really need, it's just that they won't display on the screen!].

11618

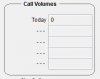
I would agree that it would be cool to have a dynamic simultaneous call graph (space permitting). I'll have a think about it... Incidentally the 'Call Volumes' section:
11619

probably does what you were describing. Each of the 5 timeframes section can be configured by clicking on the timeframe label (or the '- - -' which signifies disabled) to select any/multiple timeframe(s) you desire.

I'm open to suggestions for improvements to this program and appreciate your feedback.
 
Hello again @dkirk-ads
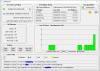
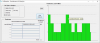
So you got me thinking, the result of which is CallSequitur v3.1.0 which now has a selectable 'live' chart view of either call volumes or simultaneous calls over the last 24 hours (in addition to the fully configurable timeframes in the Sim Call Analysis section). The chart updates once per minute or on the CDR poll cycle (whichever is the greater). Incidentally the bit in my previous posting about 10 trunks isn't quite true any more with this new version: Up to 5 trunks can be displayed and you can select the ones you want to see on this screen (so there's always space for the chart).
Just for anyone else reading this: It is important to remember that the Simultaneous Call count calculation relies on CDRs which are only produced after a call is terminated - so whenever the chart updates there may be sim call count activity updates that are retrospective.

11796
 
Understood and this version is running great. Love the new graph on the main screen and this program is becoming more critical for serious 3CX installations.
 
I just noticed the latest build now displays incoming calls being answered by the IVR attendant and then displays the extension they transferred to. On one line we now see the full path of the call, VERY cool, thanks.
 
Status
Not open for further replies.

Forum statistics

Threads
111,933
Messages
589,810
Members
164,808
Latest member
jsbjsb