Queue Statistics not adding up

Nathan Prewett

Gold Partner
Basic Certified
Joined
Feb 10, 2025
Messages
9
Reaction score
0
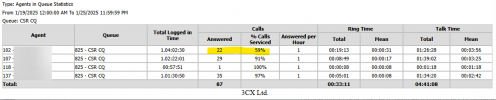
I am trying to figure out why the Agents in Queue Statistics report doesn't add up. This is a v18 system.
example:
zOsazSabHI.png

As shown there's 22 answered and 59% serviced. That would imply there were 37 calls offered to x102 but the call log for the same time shows only 7 unanswered calls for x102
I'm not sure how this 59% is calculated and I am looking for some clarification.

Thanks.
 
Are you using schedule queue statistics reset?

**nvm ignore that. this doesnt affect reports

check this out

 
Last edited:
its to do with polling.

Lets say 102 was polled 37 times.

22 of those polls he answered.

22/37*100 = 59%
 
Ok I read that post and unfortunately he never explains what he discovered about how the calculation works. I ran the same report that's in that post though and I still don't see how we got to 59% for x102
1739295381240.png
In this it looks like there were 48 polls to x102 with 22 serviced and 26 unanswered. That also doesn't come out to 59%

Thanks for the help.
 
What is your polling strategy?

26 polls doesnt necessarily mean 26 calls.

your reports dont match.. have you filtered by calls answered after x?

that says 90 were answered and the other 87.
 
Polling is Fewest Answered

As for the reports not matching I'm not sure what to say. It's the same time period for both reports, they should be the same numbers.

>26 polls doesnt necessarily mean 26 calls.
it should mean at least that many though, and anything that is polled but then passed to the next agent should count as unanswered should it not? So 26 polled in the unanswered column is 26 calls that were offered to that extension that were not answered by that extension. Conversely 22 other calls were offered to and serviced by that extension. So in my mind that's 22 serviced of 48 potential which is 46%

At the end of the day I just need to understand how the % calls serviced is calculated otherwise it holds no value as a statistic.
 
Still looking for understanding on this if anyone has an idea of how this stat is calculated.
 
Plz. note, it is the Queue that lose the calls, not the agent! The user might have had 26 polls - and then you may ask the agent why, it might have been for one call during a long toilet brake:-)
 
I can accept that logic but it still doesn't help me understand the % Calls Serviced and why it doesn't line up with anything else in any other report. Nothing in the reports for the queue or the user allows me to come up with that 59% and that's the part I'm trying to understand.
 
I can accept that logic but it still doesn't help me understand the % Calls Serviced and why it doesn't line up with anything else in any other report. Nothing in the reports for the queue or the user allows me to come up with that 59% and that's the part I'm trying to understand.
For v18, I do not believe you will have an answer to your question.

A few things we found and corrected for during our JEDWare development:

While 3CX provides built-in reports, they follow their own rules that may not always align with business needs. For example:
  • Calls will be marked as abandoned if they are redirected to eg. another queue.
  • Agents may receive credit for calls they never actually participated in.
  • Call durations may count the entire conversation rather than the actual time an agent spent speaking with the customer.
Source: https://jed-ware.com/jedware-philosophy-for-our-3cx-reporting/
 
Thank you for this info, it does help explain why cross-refencing other reports doesn't work.
 

Latest Posts

Forum statistics

Threads
111,963
Messages
589,998
Members
164,868
Latest member
swegner
