- Joined
- Apr 15, 2022
- Messages
- 2
- Reaction score
- 0
Howdy!
Running 18.0 Update 5 Build 418
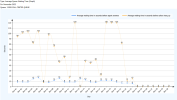
While trying to figure out the average caller wait time in a Queue I ran the "Average Queue Waiting Time (Graph)" Report as well as the "Detailed Queue Statistics" with both pulling from only 1 queue with the settings for day by day. However it appears that the two reports give conflicting data as seen in the attachments below the detailed report from 11/13/2002 12:00 AM to 11/19/2022 11:59:50PM shows a ring time mean of 13s, however the graph from those days shows 15, 13, 9, 8, 12, 12, 12 which is a mean of 11.57, about a second and a half off from the Detailed statistic report
Hoping someone can help shed some light on how this data is conflicting and or what is actually the accurate data on users in the IVR's Queue only
thanks
Running 18.0 Update 5 Build 418
While trying to figure out the average caller wait time in a Queue I ran the "Average Queue Waiting Time (Graph)" Report as well as the "Detailed Queue Statistics" with both pulling from only 1 queue with the settings for day by day. However it appears that the two reports give conflicting data as seen in the attachments below the detailed report from 11/13/2002 12:00 AM to 11/19/2022 11:59:50PM shows a ring time mean of 13s, however the graph from those days shows 15, 13, 9, 8, 12, 12, 12 which is a mean of 11.57, about a second and a half off from the Detailed statistic report
Hoping someone can help shed some light on how this data is conflicting and or what is actually the accurate data on users in the IVR's Queue only
thanks