Inconsistent Metrics: 3CX Built-in Report vs Grafana (PostgreSQL Source)

Gummies

Premier Customer
Advanced Certified
Joined
Apr 30, 2020
Messages
33
Reaction score
13
Hi everyone,


I'm encountering a discrepancy between the statistics shown in the 3CX Detailed Queue Statistics report and the data I’m analyzing via Grafana, which is sourced from a PostgreSQL database using the official 3CX Data Connector.


Time Range: July 11, 2025
Queue: (same in both tools)


3CX Detailed Queue Statistics:

1752532898773.png
  • Total Calls: 282
  • Answered Calls: 72
  • Answered %: 26%
  • Total Talking Time: 14:55:26

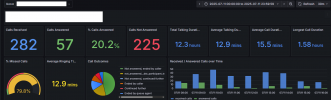
Grafana (based on PostgreSQL via Data Connector):
1752532931078.png

  • Total Calls: 282
  • Answered Calls: 57
  • Answered %: 20.2%
  • Total Talking Time: ~12.3 hours


I’m using the built-in Data Connector tool (PostgreSQL, port 8083) and I confirmed the connection is working fine. I haven’t checked the box to delete data after transfer.


Has anyone experienced similar differences in metrics between the native reports and the PostgreSQL-exported data?


  • Could the internal 3CX reports be using different filters/logic than the CDRs?
  • Is there documentation on how the Data Connector structures the CDRs or which fields should be used to match “answered” calls?
  • Are callbacks or certain transfer scenarios included differently?

Any insight or clarification would be appreciated.


Thanks in advance!

 

Attachments

  • 1752532912830.png
    1752532912830.png
    18 KB · Views: 14
  • Like
Reactions: bihr
Hello Dear team
They are not the same and we are going to have this moving forward.
The inbuilt reports were always calculating callbacks separately.
(72 Answered calls - 15 serviced callbacks = 57 which is the value you see in Grafana as answered calls.)
The new Grafana report "03. Queues" doesn't show information about callbacks currently. We are working on it.

Q: Is there documentation on how the Data Connector structures the CDRs or which fields should be used to match “answered” calls?
A: The official documentation is here:
https://www.3cx.com/docs/call-detail-record-guide/

All information is in the cdroutput table. It's a flat table and very easy to read.
 
Thank you @nikolascx

That explanation helped a lot — I just double-checked and confirmed that the difference is indeed due to the serviced callbacks being included in the native report but excluded in the Grafana view.


Now everything makes perfect sense.


Really appreciate your quick and clear response!
 
Hello all,

I’m also noticing inconsistencies in my stats (3CX report) and Grafana PostgreSQL.
Except that in my case, it’s the other way around…


I have more calls on the Grafana side, and fewer on the 3CX report, over the same period.
Is there any explanation for this discrepancy on the stats side?
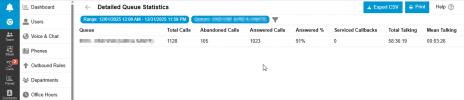
1767704888066.png

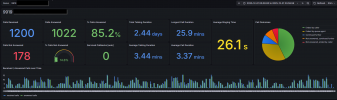
And for grafana : 1767705188652.png
Stats are for the month, and the difference is huge, isn’t it?
Thank you for your feedback.


Kind regards,
 
Hi thanks for your feedback
Can you make sure you are using the latest 3CX Grafana plugin and try again.
Confirm what version you are using.

The problem is not as bad as it looks — I will explain.
The Answered calls match..
What does not match are the total calls and the failed calls.
And if you look at the numbers closely, there is a discrepancy of 72 calls

Total calls in Grafana 1200 = Total calls in report 1128 + 72
Calls not answered in grafana 178 = Abandoned calls 105 + 72
So we can conclude with certainty that the overhead calls are all failed calls and potentially polling calls.

I think that the SQL in this Grafana report is catching 72 polling (failed) calls that the report does not catch — In this case the 3CX report is correct.

Update the grafana plugin first. And make the same report. If the issue persists let us know.
 
Hi Nikolas,

Thank yo for your reply,
My grafana plugin version is 1.0.4 (latest)

Ok i understand your analyse , maybe it could be interested to highlight the polling failed call statistics in the dashboard ?
Then it will be possible to have the same statistics on the Grafana side and in the 3CX reports.
 
  • Like
Reactions: Evolute IT
Thanks for your update.
We will need your backup. Can you create a backup, and send it to me privately.
After this, we will take care to restore this in isolation. Let us know the exact query you run.
 
Dear @PC974
thank you for your help on the matter.
We checked and discovered what those extra calls are.

The 72 calls are calls that occurred After hours / When 3CX was switched to Out of office hours.
This means that these 72 Calls never made it to the Queue Engine. So they cannot be reported by the Queue Reports in the 3CX Reports.
When I look at the situation now, I see that actually the Grafana Dashboard is more accurate than the 3CX built in reports. Because the INTENT of that "After hour failed call" was originally directed to the Queue Number. So it should be counted as a Queue call.

On the other hand, the call was not served / handled by the Queue so it is a failed queue call, but not because the agents were lazy. Its because the call occurred out of office hours.

To be honest, Im not sure what to do.

For sure, the 3CX Reports cannot show these calls.
An option would be to represent a visual in Grafana named "After Hour Calls" and show the missed "Queue" Calls that occurred after hours separately.

I'm inclined more to leave everything as it is.

Let me know your thoughts - Thanks so much

1767876371575.png
 
  • Like
Reactions: MayurPatel
Hello Nikolas,


Thank you very much for the quick reply and debugging.
I think it could be useful to have these statistics on the dashboard, as it can help prevent misinterpretation of stats between the 3CX reports and the Grafana CDR.
Or maybe just add some informations :) like :
1767881268622.png

Did you create a special SQL query to count the number of after-hours calls?
If you keep the dashboard as it is, would it be possible to share the SQL query?


Best regards,
 
Last edited:
Its not exactly a single SQL - Because all the visuals are based on a panel.
Check this dashboard - its for PostgreSQL

You should see After Hours Failed Calls
Extract and import to Grafana
Let us know.
 

Attachments

Hi @nikolascx,
I also agree that the After Hours metric makes sense, and would be very interesting for some customers, already asking for it :)
 
Hi all,
Thanks for sharing Nikolas. That's cool.
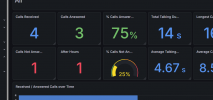
I think it might be easier to understand if we created a dashboard like this, maybe? What do you think?
1767948516892.png


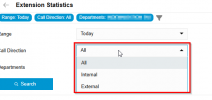
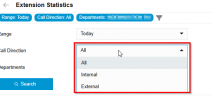
In the same way as the 3CX report, it could be useful in the “Extension Statistics” in grafana to be able to choose to display only external calls or only internal calls or both. Maybe i can open a new post for this ?
1767949011858.png

regards
 

Attachments

  • 1767948994201.png
    1767948994201.png
    9.1 KB · Views: 5
Actually Yes - I really like it. Well done!
We will do it like this. Thanks for reporting!
 

Members Online Now

Forum statistics

Threads
111,832
Messages
589,284
Members
164,662
Latest member
DejanMDS