- Joined
- Apr 30, 2020
- Messages
- 34
- Reaction score
- 14
Hi everyone,
I'm encountering a discrepancy between the statistics shown in the 3CX Detailed Queue Statistics report and the data I’m analyzing via Grafana, which is sourced from a PostgreSQL database using the official 3CX Data Connector.
Time Range: July 11, 2025
Queue: (same in both tools)
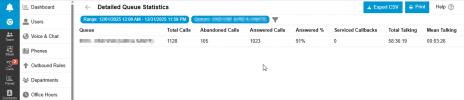
3CX Detailed Queue Statistics:

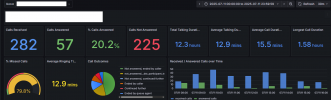
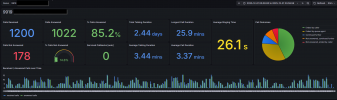
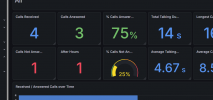
Grafana (based on PostgreSQL via Data Connector):
I’m using the built-in Data Connector tool (PostgreSQL, port 8083) and I confirmed the connection is working fine. I haven’t checked the box to delete data after transfer.
Has anyone experienced similar differences in metrics between the native reports and the PostgreSQL-exported data?
Any insight or clarification would be appreciated.
Thanks in advance!
I'm encountering a discrepancy between the statistics shown in the 3CX Detailed Queue Statistics report and the data I’m analyzing via Grafana, which is sourced from a PostgreSQL database using the official 3CX Data Connector.
Time Range: July 11, 2025
Queue: (same in both tools)
3CX Detailed Queue Statistics:
- Total Calls: 282
- Answered Calls: 72
- Answered %: 26%
- Total Talking Time: 14:55:26
Grafana (based on PostgreSQL via Data Connector):
- Total Calls: 282
- Answered Calls: 57
- Answered %: 20.2%
- Total Talking Time: ~12.3 hours
I’m using the built-in Data Connector tool (PostgreSQL, port 8083) and I confirmed the connection is working fine. I haven’t checked the box to delete data after transfer.
Has anyone experienced similar differences in metrics between the native reports and the PostgreSQL-exported data?
- Could the internal 3CX reports be using different filters/logic than the CDRs?
- Is there documentation on how the Data Connector structures the CDRs or which fields should be used to match “answered” calls?
- Are callbacks or certain transfer scenarios included differently?
Any insight or clarification would be appreciated.
Thanks in advance!



 like :