- Joined
- Jun 21, 2019
- Messages
- 4
- Reaction score
- 0
Hi folks,
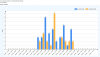
I've been trying to put together some reports for management on the performance of our helpdesk call answer rates, and came across something strange. The "Queue Answered / Unanswered Calls" graph flagged one day as having 45 unanswered calls vs 40 answered. On drilling down to the hourly reports for that day I got the following graph:
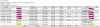
I then tried to get a report of all calls that went to the Helpdesk queue (xtn8000) and got this:

How is the system reporting 9 unanswered calls when there were only two calls that hour?
The queue has 1-4 agents signed in at at any time depending on breaks/meetings, is using Polling Strategy: Ring All and goes for 15 seconds before retrying - is it registering multiple attempts to call each agent before one of them picks up?
Any help or guidance would be appreciated so I can put together some useful reports.
I've been trying to put together some reports for management on the performance of our helpdesk call answer rates, and came across something strange. The "Queue Answered / Unanswered Calls" graph flagged one day as having 45 unanswered calls vs 40 answered. On drilling down to the hourly reports for that day I got the following graph:
I then tried to get a report of all calls that went to the Helpdesk queue (xtn8000) and got this:
How is the system reporting 9 unanswered calls when there were only two calls that hour?
The queue has 1-4 agents signed in at at any time depending on breaks/meetings, is using Polling Strategy: Ring All and goes for 15 seconds before retrying - is it registering multiple attempts to call each agent before one of them picks up?
Any help or guidance would be appreciated so I can put together some useful reports.