- Joined
- Jun 18, 2021
- Messages
- 6
- Reaction score
- 0
Hi All,
I have a customer that has run off two standard 3CX reports, first is a “Call Distribution” graph report and 2nd is a "User Activity" graph report. Both reports are filtered on same single day and same single extension see attached.
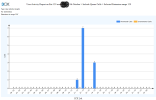
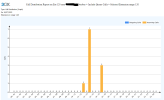
Question 1 . “Call Distribution” report shows 7 calls taken by phone extension 120 between 12 and 1pm and the other report (“User Activity”) shows no calls taken in that hour yet the report data is taken from the same source. We are not sure why this is different can you help please ?
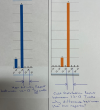
Question 2. On “Call Distribution” report and “User Activity” report I would expect also that the 7 calls taken between 12 and 1pm to broken down into 2 separate columns so it would show 3 calls between 12 and 12:30pm and 4 calls between 12:30 and 1pm, why are the reports not showing this please?
All calls are very short and do not go on into the next 30 minute period on graph x axis. Time of system has been checked and even if it was wrong the data collected and reports ran against it should show same graph results.
Kind regards
I have a customer that has run off two standard 3CX reports, first is a “Call Distribution” graph report and 2nd is a "User Activity" graph report. Both reports are filtered on same single day and same single extension see attached.
Question 1 . “Call Distribution” report shows 7 calls taken by phone extension 120 between 12 and 1pm and the other report (“User Activity”) shows no calls taken in that hour yet the report data is taken from the same source. We are not sure why this is different can you help please ?
Question 2. On “Call Distribution” report and “User Activity” report I would expect also that the 7 calls taken between 12 and 1pm to broken down into 2 separate columns so it would show 3 calls between 12 and 12:30pm and 4 calls between 12:30 and 1pm, why are the reports not showing this please?
All calls are very short and do not go on into the next 30 minute period on graph x axis. Time of system has been checked and even if it was wrong the data collected and reports ran against it should show same graph results.
Kind regards