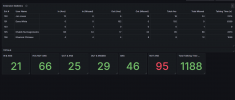
Update 6 BETA - Grafana Reporting Is Finally Here!

Set of postgress coming up soon.
Check this overview dashboard - import it and let me know
We will have the others very shortly..
this is for PostgeSQL
Put the Table path without the IP and port in the top of the dashboard.

View attachment 47633
worked good..thanks...
 
  • Like
Reactions: nikolascx
Why not yes - If it is only for you, its great..
Is it a busy system? It depends on what load you process and what resources you have available.
I was under the impression that 3CX recommended the PBX machine be dedicated to 3CX and nothing else installed on it. Has this changed?
 
@SweetAction Yes you are correct you should not install any additional software. It's possible to connect Grafana directly to the CDR table on the 3CX PBX machine but you will need to open up ports and it will be a tremendous security risk as you are opening access to the configuration database of 3CX to the internet. Also you need to purge the CDR table regularly to keep database compact and performant. So install postgress on another machine or use a cloud database whatever you prefer.

We are working on other options to be able to take summary reports from past data too so if you don't want extensive reports you can just download summaries and this might be enough for smaller installs.
 
any reason this wouldn't work on a multi-company 3cx instance? Or any special considerations for configuration? I deployed a PG database on linux, configured the data connector in 3cx, it completes "Test" successfully. Made some calls in and out of the system for recent CDR. Selected the 'Transfer CDR data now", but when i look in pgAdmin, I don't see that any database tables or records have been created. Also, when i click Test or Transfer Data, no activity in the postgres logs. Tcpdump shows some traffic on the linux VM when I click test, but now when I click Transfer. Thanks in advance!

P.S. we are super excited for this feature! thanks for your work on this.
 
Last edited:
HI Team

Ring group Dashboard for PostgreSQL included.
Guys - Templates for Postgres do not need a URL - So the Variable is hidden. They will all default to public.cdroutput.
Ensure that you configure the plugin correctly.

Queues Dashboard somewhat close - Queue filter giving me some trouble.. Needs more testing so I did not include it yet..
 

Attachments

Last edited:
any reason this wouldn't work on a multi-company 3cx instance? Or any special considerations for configuration? I deployed a PG database on linux, configured the data connector in 3cx, it completes "Test" successfully. Made some calls in and out of the system for recent CDR. Selected the 'Transfer CDR data now", but when i look in pgAdmin, I don't see that any database tables or records have been created. Also, when i click Test or Transfer Data, no activity in the postgres logs. Thanks in advance!

P.S. we are super excited for this feature! thanks for your work on this.

It should work - Can you check the Server event logs? Everything is being posted in there. But you are on the right track.
1 Prep Debian Machine
2 Configure CDR offload. (The fact that TEST works, means the connection is working.
3 Make some calls
4 Transfer now so you do not wait
5 Connect using pgadmin to your PostgreSQL and you should see data.
6 Configure Grafana plugin and load the dash
 
  • Like
Reactions: Evolute IT
HI Team

Ring group Dashboard for PostgreSQL included.
Guys - Templates for Postgres do not need a URL - So the Variable is hidden. They will all default to public.cdroutput.
Ensure that you configure the plugin correctly.

Queues Dashboard somewhat close - Queue filter giving me some trouble.. Needs more testing so I did not include it yet..
Any chance we will get more options for the export schedule? Every 5/10/15/30 minutes would help a lot for big call centers. Even a real-time option (feel free to warn about CPU/RAM resources when using that) would be greatly beneficial!
 
Any chance we will get more options for the export schedule? Every 5/10/15/30 minutes would help a lot for big call centers. Even a real-time option (feel free to warn about CPU/RAM resources when using that) would be greatly beneficial!
HI Team
Working on it. Trying to decrease the time as we gain experience.
Machine metrics we have a plan also. WIP
 
Hello Team
PostgreSQL Template for Queues available now.
Re-packaged everything.. This is the postgres full set.
 

Attachments

any reason this wouldn't work on a multi-company 3cx instance? Or any special considerations for configuration? I deployed a PG database on linux, configured the data connector in 3cx, it completes "Test" successfully. Made some calls in and out of the system for recent CDR. Selected the 'Transfer CDR data now", but when i look in pgAdmin, I don't see that any database tables or records have been created. Also, when i click Test or Transfer Data, no activity in the postgres logs. Tcpdump shows some traffic on the linux VM when I click test, but now when I click Transfer. Thanks in advance!

P.S. we are super excited for this feature! thanks for your work on this.
One item that was needed after installing postgres was modifying the pg_hba.conf in the \data directory specifying what machines or ip's can connect to the DB.
 
Customer has some Azure credits to use, i was gonna spin up a Debian VM and use postgres for testing. Is this viable or should I wait for 3CX to come up with an Azure solution (if ones coming)?
 
  • Like
Reactions: Evolute IT
One item that was needed after installing postgres was modifying the pg_hba.conf in the \data directory specifying what machines or ip's can connect to the DB.

Hold on - you should not be pointing Grafana to your 3CX.
You need to point Grafana to the Postgres instance you created which is specifically dedicated to CDR offload.
 
Customer has some Azure credits to use, i was gonna spin up a Debian VM and use postgres for testing. Is this viable or should I wait for 3CX to come up with an Azure solution (if ones coming)?

You can - as long as it is postgres.
But for azure we will probably make Data Lake with PowerBI. (Grafana has no official plugin for Azure Data lake). It's still unclear at the moment.. We need some more time.
 
  • Like
Reactions: Evolute IT
Hello Team
PostgreSQL Template for Queues available now.
Re-packaged everything.. This is the postgres full set.
Thank you for getting these started. Had to make a few tweaks to get the data working on mine. For new dashboards I find once imported make a copy. This way you avoid the dashboard not found error when saving edits. On some of these I went into settings on the dashboard and changed variable db_table_path to be public.cdroutput as default and in the queries change to use ${db_table_path} variable so you can just update the variable to fit your needs and all queries work. In the Queues dashboard you will want to update Total Calls query to following to avoid divide by 0 error. I am liking Grafana and pretty easy to maneuver around.

SELECT
COUNT(DISTINCT q.call_history_id) AS Total_Calls,
ROUND(
100.0 * COUNT(DISTINCT CASE
WHEN EXISTS (
SELECT 1
FROM ${db_table_path} cdr
WHERE cdr.call_history_id = q.call_history_id
AND cdr.termination_reason IN ('src_participant_terminated', 'dst_participant_terminated')
AND cdr.cdr_answered_at IS NOT NULL
) THEN q.call_history_id
ELSE NULL
END)::NUMERIC / NULLIF(COUNT(DISTINCT q.call_history_id), 0),
1
) AS Answer_Rate
FROM ${db_table_path} q
WHERE
q.destination_entity_type = 'queue'
AND (
'public' = 'All'
OR q.destination_dn_number = SPLIT_PART('public', ' - ', 1)
)
AND q.cdr_started_at >= '2025-04-27'::TIMESTAMP
AND q.cdr_started_at < ('2025-04-28'::TIMESTAMP + INTERVAL '1 day');
 
Hold on - you should not be pointing Grafana to your 3CX.
You need to point Grafana to the Postgres instance you created which is specifically dedicated to CDR offload.
Yes. That is what I am doing. For 3cx to write to PostGres the config file on PostGres needed an entry for 3cx to connect to the PostGres DB and write to it. Then I have Grafana pointed to PostGres like you said. By default no external IP's can connect to PostGres when installed I found. So I just added the 3cx IP to to be allowed to connect to PostGres. Grafana is not pointed to 3cx. When I say PostGres, not the 3cx DB, but the new postgres install to store the CDR. Thanks.
 
  • Like
Reactions: nikolascx
Yes you are right - You need to touch pg_hba.conf. we will release a script that will set everything up for you.

Thank you for getting these started. Had to make a few tweaks to get the data working on mine. For new dashboards I find once imported make a copy. This way you avoid the dashboard not found error when saving edits. On some of these I went into settings on the dashboard and changed variable db_table_path to be public.cdroutput as default and in the queries change to use ${db_table_path} variable so you can just update the variable to fit your needs and all queries work. In the Queues dashboard you will want to update Total Calls query to following to avoid divide by 0 error. I am liking Grafana and pretty easy to maneuver around.

SELECT
COUNT(DISTINCT q.call_history_id) AS Total_Calls,
ROUND(
100.0 * COUNT(DISTINCT CASE
WHEN EXISTS (
SELECT 1
FROM ${db_table_path} cdr
WHERE cdr.call_history_id = q.call_history_id
AND cdr.termination_reason IN ('src_participant_terminated', 'dst_participant_terminated')
AND cdr.cdr_answered_at IS NOT NULL
) THEN q.call_history_id
ELSE NULL
END)::NUMERIC / NULLIF(COUNT(DISTINCT q.call_history_id), 0),
1
) AS Answer_Rate
FROM ${db_table_path} q
WHERE
q.destination_entity_type = 'queue'
AND (
'public' = 'All'
OR q.destination_dn_number = SPLIT_PART('public', ' - ', 1)
)
AND q.cdr_started_at >= '2025-04-27'::TIMESTAMP
AND q.cdr_started_at < ('2025-04-28'::TIMESTAMP + INTERVAL '1 day');

You are welcome! And thanks so much for the feedback
I have an open ticket with Grafana support to tackle the errors on import.. You are correct. What you see happened also to me - but not every time.. Bear with us until we get our final templates checked.


For postgress you can hardcode the variable (Im removing it completely). I think you have an older template - I uploaded another set just 1 hour ago. Check the thread.
Once you configure the plugin just default everything to public.cdroutput

Do you like this?
1745859125705.png

As a Thank you for your feedback, find an Extension statistics replica
Try it out - its in the zip file attached. ;)

3CX TEAM
Do not worry - We are working with Grafana to publish all prod templates to the Grafana Dashboard Marketplace!! So soon there will be one prod final version set of dashboards available.
 

Attachments

Yes you are right - You need to touch pg_hba.conf. we will release a script that will set everything up for you.


You are welcome! And thanks so much for the feedback
I have an open ticket with Grafana support to tackle the errors on import.. You are correct. What you see happened also to me - but not every time.. Bear with us until we get our final templates checked.


For postgress you can hardcode the variable (Im removing it completely). I think you have an older template - I uploaded another set just 1 hour ago. Check the thread.
Once you configure the plugin just default everything to public.cdroutput

Do you like this?
View attachment 47655

As a Thank you for your feedback, find an Extension statistics replica
Try it out - its in the zip file attached. ;)

3CX TEAM
Do not worry - We are working with Grafana to publish all prod templates to the Grafana Dashboard Marketplace!! So soon there will be one prod final version set of dashboards available.
Thanks for your hard work Nikolas! We were very pleased with the U6 data export! It will get better I know!
 
Yes you are right - You need to touch pg_hba.conf. we will release a script that will set everything up for you.


You are welcome! And thanks so much for the feedback
I have an open ticket with Grafana support to tackle the errors on import.. You are correct. What you see happened also to me - but not every time.. Bear with us until we get our final templates checked.


For postgress you can hardcode the variable (Im removing it completely). I think you have an older template - I uploaded another set just 1 hour ago. Check the thread.
Once you configure the plugin just default everything to public.cdroutput

Do you like this?
View attachment 47655

As a Thank you for your feedback, find an Extension statistics replica
Try it out - its in the zip file attached. ;)

3CX TEAM
Do not worry - We are working with Grafana to publish all prod templates to the Grafana Dashboard Marketplace!! So soon there will be one prod final version set of dashboards available.
Thanks. That worked right out of the gate.
 
You can - as long as it is postgres.
But for azure we will probably make Data Lake with PowerBI. (Grafana has no official plugin for Azure Data lake). It's still unclear at the moment.. We need some more time.
thanks.

i'll have a play with a vm then and see whats what.

im assuming then my data is copied from 3CX to postgres and not removed (like POP mail) so i could do it over and over? (providing i dont check the box to remove data)
 
It should work - Can you check the Server event logs? Everything is being posted in there. But you are on the right track.
1 Prep Debian Machine
2 Configure CDR offload. (The fact that TEST works, means the connection is working.
3 Make some calls
4 Transfer now so you do not wait
5 Connect using pgadmin to your PostgreSQL and you should see data.
6 Configure Grafana plugin and load the dash
Still getting no traffic hitting my postgreSQL server from my multi-company 3CX instance when selecting "transfer now" in the data connection dash. TCPDUMP on the pg server, i get traffic when I click "test", but nothing when I click transfer. still no tables created in the DB.

I initially thought it was something strange with my pgsql deployment since I deployed via a docker, but I have just redeployed to a dedicated ubuntu VM, configured using your script, opened firewall port, and same behavior. I also dont see any activity in the 3cx dashboard server/event log when testing or triggering a transfer now.

anything else I can check?
 

Forum statistics

Threads
111,991
Messages
590,167
Members
164,929
Latest member
Cloudstar