V20 U6 Final - All Improved Reporting

One feature I really need is being able to set the internal number that shows to other users so we can present group numbers. Its the biggest bug bear as staff then ring the number from the missed call but that person could be out or away from their desk. This helps with departments that call when working from home.

Any chance of that being added?

Hi @pa_an_br
Please explain your case better.

Set the internal number - what internal number do you refer to? Where do you want to set this?
That shows to other users - you mean your other extensions? Your colleagues? Caller ID? Which caller ID?
So we can present Group Numbers - what exactly do you want to present? What call do you make? Where you want to present the group number?

Make it like this:
A calls B
I see 100 on the caller id display of the phone (or 3CX Android App) or on the Webclient.
I with to see 555 instead
Reason: Like this my users can be more efficient when redialing back the number.. Etc etc
 
I'm not seeing the update as an option in our Hosted instance of 3CX. It shows that it is checking for updates, but always comes back as Up To Date. This instance has not received an update since December 2024. Any suggestions on how to push this update through?
 
Thanks for your reply. No luck with that though unfortunately, still nothing coming through. License is definitely valid, but still stuck at 20.0.
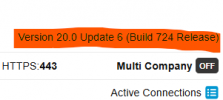
Hi, just to clarify even on the latest update 6 it would be 20.0:

1752490855285.png

Could you put logs in debug, check for updates, log back to normal, and see if anything relevant to the update check shows?
 
Hi, just to clarify even on the latest update 6 it would be 20.0:

View attachment 48615

Could you put logs in debug, check for updates, log back to normal, and see if anything relevant to the update check shows?
Our instance is at "Version 20.0 Update 4 (Build 487 Release)". Nothing coming up in the Verbose logs from what I can see.
 
I'm encountering a discrepancy between the statistics shown in the 3CX Detailed Queue Statistics report and the data I’m analyzing via Grafana, which is sourced from a PostgreSQL database using the official 3CX Data Connector.


Time Range: July 11, 2025
Queue: (same in both tools)


3CX Detailed Queue Statistics:

1752532898773.png
  • Total Calls: 282
  • Answered Calls: 72
  • Answered %: 26%
  • Total Talking Time: 14:55:26

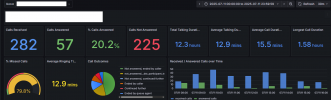
Grafana (based on PostgreSQL via Data Connector):
1752532931078.png

  • Total Calls: 282
  • Answered Calls: 57
  • Answered %: 20.2%
  • Total Talking Time: ~12.3 hours


I’m using the built-in Data Connector tool (PostgreSQL, port 8083) and I confirmed the connection is working fine. I haven’t checked the box to delete data after transfer.


Has anyone experienced similar differences in metrics between the native reports and the PostgreSQL-exported data?


  • Could the internal 3CX reports be using different filters/logic than the CDRs?
  • Is there documentation on how the Data Connector structures the CDRs or which fields should be used to match “answered” calls?
  • Are callbacks or certain transfer scenarios included differently?

Any insight or clarification would be appreciated.


Thanks in advance!
 
Hi Everyone
Is there any Grafana reports per department?
 
@Gummies
Please try and avoid duplicate messages
You have another one here
 
@diplodock ,

You can have a look at our video (
) although it is touched on rather briefly, on how you can edit the query of a dashboard. Adding variables or using transformations on that can let you easily filter displayed data.

There are plenty of tutorials online that can guide you on how to create and apply such filters to any dashboard.
 
  • Like
Reactions: N_G and Evolute IT
@diplodock ,

You can have a look at our video (
) although it is touched on rather briefly, on how you can edit the query of a dashboard. Adding variables or using transformations on that can let you easily filter displayed data.

There are plenty of tutorials online that can guide you on how to create and apply such filters to any dashboard.
As I understand - direct edit of dashboard query and variables?
 
As I understand - direct edit of dashboard query and variables?
You can go in Grafana, name a field as a variable, put that variable in the query and it becomes a drop down in the stats view. That's the overview.
 
  • Like
Reactions: Evolute IT
Hi @diplodock
Import this dashboard and let us know what you think ;-)
Thanks for your feedback
Unfortunately, there are errors in the report. For example, it is indicated that there was a call to a missed phone number, but upon checking it turned out that there was no call. We are talking about the processing of the call queue by operators, processing of missed calls.
 
Hello,

Not really about the reporting subject, but when 3CX IA came I remember you said that "the feeling note" will come in next updates soon after the first release, but we are still not news about it.

Do we have a ETA to get it with 3CX IA integration or it will be a OpenIA feature only ?

Thank you, best regards.
 
Hi Everyone
Is there any Grafana reports per department?
Marhaba Shadi
Tamam, good one.

We do have plans to add the department dropdown.
In which reports would this make sense in your opinion?
Extension statistics for sure.
Inbound and outbound calls
Anything else?

Tag me with your thoughts.
 
Unfortunately, there are errors in the report. For example, it is indicated that there was a call to a missed phone number, but upon checking it turned out that there was no call. We are talking about the processing of the call queue by operators, processing of missed calls.

Yes @diplodock
As you requested early access, you received a dashboard that is not fully tested yet.

You’re welcome to report issues on development items, but I need specific details to address them. Please let me know exactly which part of the visualization fails, and send me your call logs for analysis.

You’re also welcome to review the SQL yourself - if you find and fix an issue, feel free to send the updated query to us.

Alternatively, you can wait for the general release. However, if you decide to report issues, please provide detailed information.
Saying “there was a call to a missed number but upon checking there was no call” is too vague for me to act on.

To investigate, I need:
  1. A screenshot showing the visualization with the issue (so I can have a chance to understand which sql went wrong)
  2. An export of your relevant call logs
This information will help me pinpoint the problem and work towards a solution.

Thanks so much
 
  • Like
Reactions: Evolute IT
Hello,

Not really about the reporting subject, but when 3CX IA came I remember you said that "the feeling note" will come in next updates soon after the first release, but we are still not news about it.

Do we have a ETA to get it with 3CX IA integration or it will be a OpenIA feature only ?

Thank you, best regards.

Hello Dear @KoesioOccitanieTech
Yes sentiment analysis It is coming very soon. We have a new transcriber model ready for release and is currently being tested.
Just some final parts to glue together and we will launch. For sure after August all will be set and done.
After this, it will not change again and will remain working. We also have additional features in the pipeline that depend on this so we are working top prio on transcription, and sentiment.

Looking forward for your feedback
 

Latest Posts

Forum statistics

Threads
111,991
Messages
590,167
Members
164,929
Latest member
Cloudstar