V20 Update 6 RC3

Status
Not open for further replies.
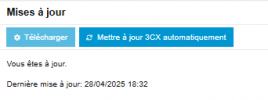
If you go to updates section it does not show anything after 5 Alpha, even if you do check for updates? Is your server able to reach the internet? Firewall check is green?
Hi @K_SAK

This is actually the situation
1750408414603.png
1750408465143.png
1750408569970.png
This is strange, could it be due to the fact that the machine was updgraded from V18 to V20

Thanks in advance for your comments
 
  • Like
Reactions: K_SAK
That's because you're on U5 Alpha. You never upgraded to the release of U5, to then have U6 as an option.

Pretty sure you can only backup/restore on a new instance from here.
Actually @ConceptsWeb ,
We tried to backup from U5 and restore to U6 on another machine and unfortunately the system doesnt accept to restore I'm stuck
 
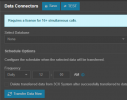
PostGreSQL Data Connector is still not working on Multi-Company instance with RC3
 
Similar problem. No update visible from version 20.0 Update 5 (Build 551 Release). Offers only "Alpha New 20.0 Update 6 Alpha". How can I install RC 3?
 
Offers only "Alpha New 20.0 Update 6 Alpha". How can I install RC 3?
You update step by step to get to RC3 from Alpha. Or wait for the final release to update directly.
 
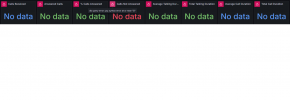
We've had the Grafana integration setup for a while now following the 3CX instructions and I've uploaded the new dashboards. They are pulling data fine and show up when logged in. When I try to set them as a public dashboard and send the link to someone else all of the widgets show "No Data" with an error message "db query error: pq: syntax error at or near "$""

I'm just using the AWS Postgres server and the hosted Grafana instance for now but they all seem to be working fine. Has anyone else tried sharing dashboards as public links and got it working?

Thanks
Grafana_No_Data.png
 
Am I right in understanding that the features Grafana Reporting and Data Connectors are only available for version 16 and above? Not available on version 8 SC Enterpr.?
 
Am I right in understanding that the features Grafana Reporting and Data Connectors are only available for version 16 and above? Not available on version 8 SC Enterpr.?
Yes, and it makes sense.

1750782278817.png
 
  • Like
Reactions: N_G
Is there a way to create free Google workspace account (not trail) or any other way to uses Grafana for reports for free for our customers?

The problem now is that if we want to schedule reports in different times a day we need external sites and to add cost to it something we can do in version 18 from 3CX itself
 
Is there a way to create free Google workspace account (not trail) or any other way to uses Grafana for reports for free for our customers?

The problem now is that if we want to schedule reports in different times a day we need external sites and to add cost to it something we can do in version 18 from 3CX itself
AWS Postgres (very cheap if you use the basic tiers), and free Grafana cloud.
 
  • Like
Reactions: Sajjad.Khurshid
AWS Postgres (very cheap if you use the basic tiers), and free Grafana cloud.
Do you know if "Azure database for PostGreSQL" would work?
 
  • Like
Reactions: Evolute IT
The PostGreSQL connector is just that, a PostGreSQL connector. So as long as PostGreSQL is exposed as is, it works.
 
Can we use local (on premise) PostGreSQL? Not Google or AWS. For Grafana reports.
 
Sweet.

Managed to get as far as pushing the data to Postgres and then getting the info in PowerBI.

Now I just need to learn how to use PowerBI xD
 
  • Like
Reactions: Evolute IT
@N_G Is there a chance to have the data connector frequency on a minute base? 1min, 5min, 10min, 15min....
Then we could fulfill customer wish for a live grafana dashboard. It also could reduce the peak load for bigger systems compared to hourly data transfer
 
@N_G Is there a chance to have the data connector frequency on a minute base? 1min, 5min, 10min, 15min....
Then we could fulfill customer wish for a live grafana dashboard. It also could reduce the peak load for bigger systems compared to hourly data transfer
Indeed, for Large Contact Centers that need to react quickly to issues, a 1hr lag may just be too long a time to react.

With minute-based refreshes, alerts in Grafana (e.g., when missed calls exceed a threshold) become more responsive and actionable.

Frequent smaller data pulls can be more efficient than large hourly queries, which can strain the system, especially with tens of thousands of CDR records or active call logs.
 
Status
Not open for further replies.

Latest Posts

Forum statistics

Threads
111,991
Messages
590,167
Members
164,929
Latest member
Cloudstar