Higher CPU Utilization

Status
Not open for further replies.

tony28

Forum User
Basic Certified
Joined
Mar 17, 2017
Messages
122
Reaction score
7
I am using standard ver 16.0.1078 and I noticed that my cpu utilization was high up to 20% in google cloud even though the 3CX dashboard only shows 3%.
Before I restarted Google VM, it was at 40%
Anyone else experienced this and how do I minimize CPU utilization. No one is using it when the CPU utilization was that high.
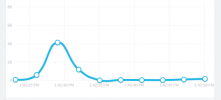
 
Is there an actual problem? Were you having audio issues, trouble loading the management console, slow dashboard response, etc? CPU monitoring is near time, not real time so the difference between what 3CX sees and what Google sees could simply be the difference as far as what the sample interval is for each of them and how they average. You've made no mention of what CPU usage has been historically so we have no point of reference. And noone using it doesn't mean anything. It takes almost nothing to handle a call if you aren't doing transcoding. Scheduled backups, scheduled reports, regular maintenance (database vacuuming, log clearing, SSL renewals) could be happening behind the scenes. I have a PBX instance open in another browser window right now and it just spiked to 40%

1609623816837.png

I'm not posting on the forums about it :) (ok well I guess I am).

CPU cycles are there to be used. Spikes happen for a variety of reasons. Now if you had a pegged high percentage like I had for this exact customer I took a snip from then that would be cause for concern. For this customer they had a failing disk and at times the database would try to do something and then hang because of the disk issue and it would be pegged at a flat 50% in the graph. This was an issue. And it was also noticed because the database service would eventually stop and other related things wouldn't work. Yours could simply be from loading the management console or viewing the activity log.
 
The VM seems to level off at 16% constantly. The only change I could think off is the upgrade. There is no 3CX activity, it is pretty much idle since no calls rare being made. The dashboard shows 3% CPU utilization but Google VM fluctuates between 14%-18%, My average CPU last time is 8%. I ran top and found at most 5% so I don't understand where the other 10% comes from
 
Last edited:
When you ran top its possible that you were only seeing the usage that top shows.

There may be other kernel processes that are not shown. Ultimately if you are happy with the usage 3CX has, then the rest of the usage is purely an OS matter so you will need to look into some Linux tutorials/forums to learn more on how to account for resources.

Note also if this is a very low powered machine, the usage of even the smallest threads can scale to large percentage numbers due to the low overall resources. (especially for google micro instances)
 
Is there a single command to shutdown 3cx from Debian or what is the command to shutdown all 3cx services without shutting down server. I tried shutting down services from 3cx management console but some cannot be turned off. I want to see the CPU utilization without 3CX running. I want to narrow down the cpu usage because usage cost is spiking more than expected.
 
It is using debian-9-stretch-v20200910 image, CPU is 20% when system is idle (3cx at 3% cpu activity). Any issues with this image using more cpu resources than necessary? I recall debian-9-stretch-v20190813 using only about 8%
 
I stopped 3CXStopServices and the CPU utilization dropped from 20% to 6%.
So definitely, it is a 3CX service causing high CPU usage even though no one is using 3CX (ver. ver 16.0.1078)
At 6%, only google_osconfig is running.
Restarting 3CXStartServices, CPU usage levels off to 18% but 3CX Dashboard shows 2% CPU usage
What is the command to start the services one by one and in what order?
I need to start the services separately for troubleshooting
Is there a command to rollback 3CX update?
The issue is that CPU usage levels off at 20% and never goes down.
 
Last edited:
What is the command to start the services one by one and in what order?
I need to start the services separately for troubleshooting
This was answere in another thread.

Is there a command to rollback 3CX update?
No, but why would you want that? 18% CPU utilization for a PBX is fine, especially in Google where I assume you haven't installed it on a 16 vCPU instance... You are probably using 2 vCPUs?

The Dashboard CPU utilization tries to concatenate the usage across multiple CPUs, so sometimesit may be slightly off. This gauge is not meant to completely replace native commands for monitoring Hardware usage, it is just there as an indicator that if e.g. it hits 100%, something is wrong.

I think you are overreacting here, because from the begining of the thread, you are going on about CPU utilization withough ever stating if you are having a problem or not.

So, are you having a problem with the actual function of 3CX?
 
After looking at the VM again, you are right.
It seems that I have an unusually high Storage PD Capacity usage, about 50x more than other 3CX VMs I have seen.
What is Storage PD Capacity and what could cause high usage?
 
I think in Google terms, PD stands for Persistent Disk.

But you still haven't answer the most important question:
Is your 3CX installation misbehaving in any way or not?
 
I am having a problem in that there is unusual high storage PD capacity usage and I am not sure if this is related to the high CPU which levels off at 20% with no activity. The Storage PD capacity usage is very high 160 gibibyte compared to 3 gibibyte in my previous 3CX.
 
Last edited:
Ok, as from what I understand, your only concern is that the CPU usage is sitting at ~20%.

This is normal, because you may think that if you are not making any calls, 3CX is idle, but in the background it is performing many tasks like maintaining registrations, cleanup tasks, checking for updates, writing log files, preventing intruder attacks, and many more.

So, summary, on a Google Instance that has 1-2 vCPUs, an idle 3CX installation is very normal.

Given that you have not mentioned any actual misbehaving of the 3CX Software, I will close this thread.

A few other points before closing:
  • For the PD Capacity usage, I think your best bet would be to ask this question on a Google forum.
  • The CPU utilization monitor in the Management Console Dashboard does not report the exact same number as if monitoring it via command line using top. Some offset here is normal, but we will see if we can bring it closer, but the Dashboard monitor's purpose I have explained above.
 
Status
Not open for further replies.

Forum statistics

Threads
111,988
Messages
590,158
Members
164,923
Latest member
2B_JPS