



Templates for Google Sheets & Excel from CSV call logs.
A 3CX employee has created a prototype tool to help users generate visual reports from their PBX call log data in Microsoft Excel or Google Sheets. You’ll recall, the CDR system has been rewritten to improve data handling and support larger deployments. Larger deployments will offload to an external database and use Grafana for reporting but for small installations Microsoft Excel or Google Sheets templates can provide sufficient analytics.
The prototype tool is an early version, provided as is, without having been tested by 3CX. But if you’d like to test drive it, we’d welcome your feedback. The templates do not use VBS or any other external components.

How It works
More detailed instructions can be found in the templates themselves, but here’s a quick overview.
Get the Templates
Two templates are provided, Google Sheets and Excel Desktop.
Get Data
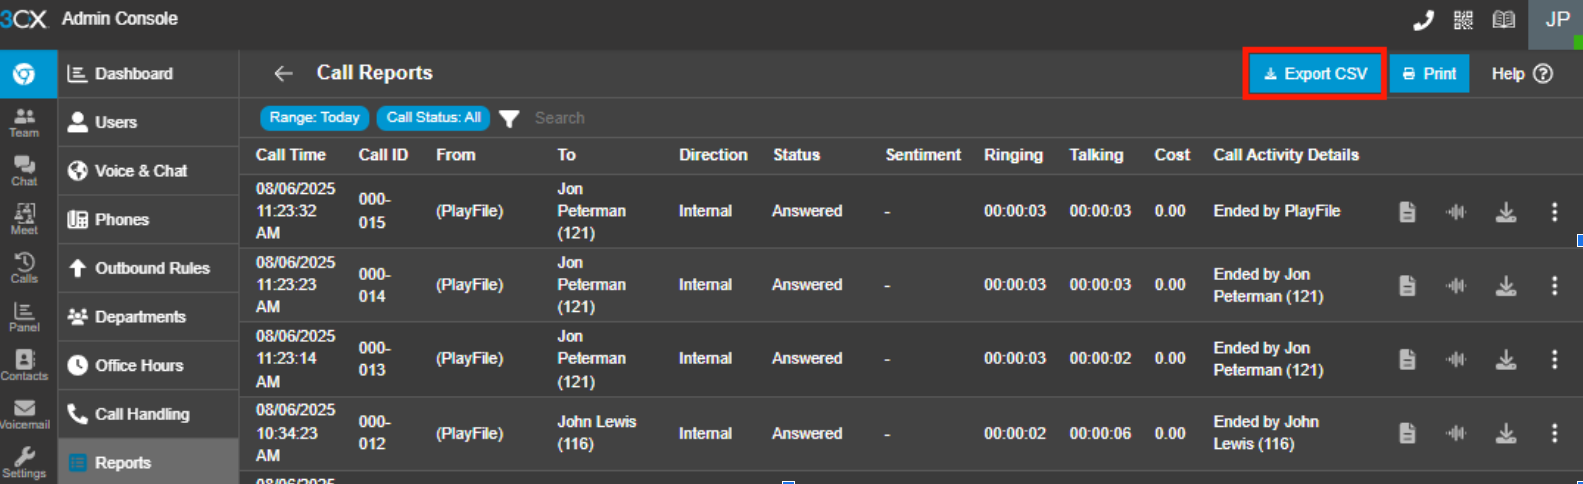
You can get the Call Log Report CSVs directly from the PBX Reports Section in Update 6 and later, or create a schedule to receive them via email. You can join multiple CSVs easily to analyze longer periods. Data from both before and after the V20 Update 6 release can be exported and used, separately or combined.
Prepare the Template
The templates are intended to be loaded with data for a period and saved, with a clean template being used whenever a new analysis is needed.
Google Sheets
Create a new copy of the template file, and name it appropriately for the data you are about to import.
Microsoft Excel
Open the template file and Save As copy, naming it appropriately for the data you are about to import.
Load the Data
Google Sheets
The steps below MUST be followed, in this order!
- File > Import to load your saved CSV in a new Sheet.
- Uncheck the “Convert text….” checkbox in the Import file confirmation dialog.
- Check that the “Total” count at the bottom is one less than the data rows, otherwise there might be lines with breaks that need clearing out before it can be used. Google Sheet should have handled this automatically.
- If you have more than 9000 rows of data, unhide and expand the Data-Output sheet. Expand its range by copying down the last line.
- Copy and Paste the data rows, minus the Header line and Totals line, into the “Data-Input” sheet of the Analytics template.
- Wait for Google Sheets to finish processing. This might take over a minute for very big imports.
Microsoft Excel
The steps below MUST be followed, in this order!
- Open the CSV file in a plain text editor such as Notepad.
- Check that the “Total” count at the bottom is one less than the data rows, otherwise there might be lines with breaks that need clearing out before importing to Excel.
- If you have more than 5000 rows of data, unhide and expand the Data-Output sheet. Expand its range by copying down the last line.
- Copy and Paste the data rows, minus the Headers line and Totals line, into the “Data-Input” sheet of the Analytics template.
Generate Analytics
Google Sheets

- In the Instructions sheet, copy or note the Report-Data value.
- On the Dashboard sheet, click the Date Range dropdown and then the Pencil icon.
- Replace the range data with the value from above.
- Choose to apply to both dropdowns, or repeat for the second one.
- Choose a Start and End date to generate Analytics for that period.
- If you choose to add more data to the same file, make sure to get the updated “Report-Data” value.
Microsoft Excel
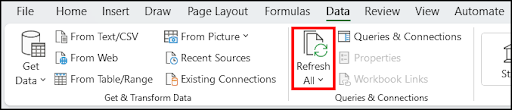
- Hit the Refresh All button in the Data menu to parse the data.
- Check that in the Dashboard sheet the 3 “slicers” are now set to 1.
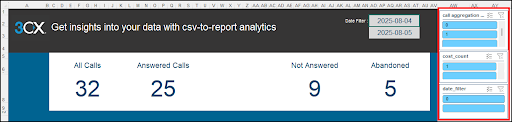
- “cost_count” may stay as 0 if the data does not contain Call Cost info.
- Select a date range.
- Hit the Refresh All button in the Data menu to generate analytics.
- If you choose to add more data to the same file, make sure to use Excel’s Remove Duplicates function and hit Refresh.
FORUM FEEDBACK
We’d love to gather your feedback on this prototype. Head over to the Forum to let us know what you think.
For instructions on how to view and get reports, see our reporting guide.









 Copyright © 2026