


New Grafana Dashboards & Reports.
Update 6 Release Candidate 3 is now live and includes 7 new Grafana dashboards as well as 3 bug fixes to existing dashboards. RC3 builds on feedback from the ALPHA, BETA, RC1 & RC2 releases and marks the last step before the final release. We envision that this release candidate will be the release version of update 6. Read on to see what’s new.
New & Updated Grafana Visuals
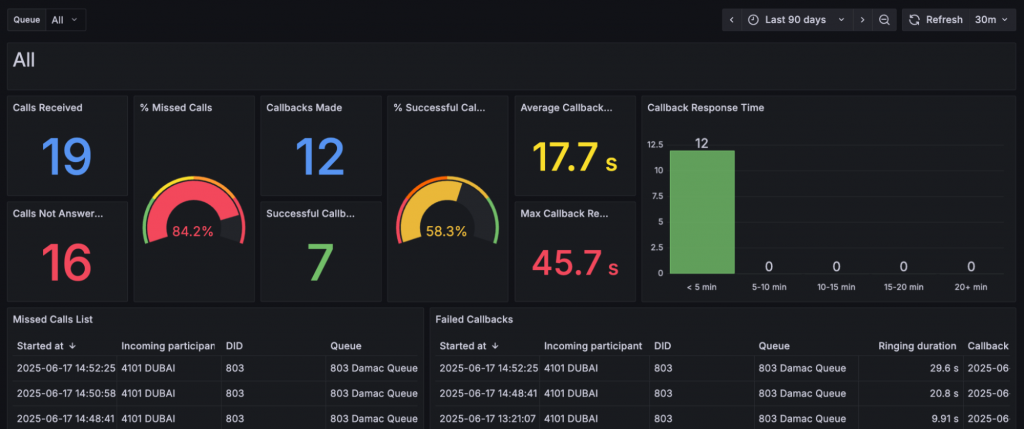
Update 6 RC3 includes 7 new dashboards and fixes to 3 existing ones based on RC2 feed. These have been added to expanded template sets for both BigQuery and PostgreSQL.
New dashboards:
- Queue missed calls and callback efficiency - Tracks missed calls, returns, and callback success. Includes response times to highlight delays and follow-up speed
- Extension statistics - Breaks down call counts, talk time, and missed calls per extension
- Inbound calls - Shows inbound volume, answer rates, and call durations
- Outbound calls - Tracks outbound activity, agent talk time, and answer rates
- Inbound vs outbound call traffic analysis - Compares inbound/outbound volume, duration, and cost
- High Value calls, consumers & extensions - Shows longest and most expensive calls by agent and customer
- Missed calls and redialed callbacks - Shows missed calls, redials, response times, and handler
Bug fixes and updates:
- Call overview - Shows total calls, top dialed numbers, answered/missed extensions, and termination reasons. Gives a quick snapshot of call activity
- Ring groups - Displays ring group stats like average ring time, call outcomes, and user activity
- Queues - Covers queue performance with stats on agent activity, call volumes and time metrics like ringing and talk time
Import 3CX Dashboards to Grafana
You can connect your external database to Grafana - a multi-platform open source analytics and interactive visualization web application.
- Configure 3CX Offload storage inside 3CX > Integrations > Data Connectors, then Select Database
- If you offload to Google BigQuery download this Google BigQuery Dashboard Package
- If you offload to a PostgreSQL server download this PostgreSQL Dashboard Package
- Log in to your Grafana Cloud Account
- Configure the Google BigQuery plugin or the PostgreSQL plugin from Grafana Data Sources section
- After the data source is connected, import the dashboard
- For Google BigQuery, access each dashboard individually and enter the bigquery URL. PostgreSQL will work without changes because the connection URL is taken from the plugin
These templates are being submitted to the Grafana Dashboard Marketplace, but for now, use the download links above.
Other Changes in RC3
Following extensive testing of RC2 we've identified and fixed a number of issues as follows below. Final release is expected shortly.
Added
- Support for Sinch Elastic SIP Trunking
- Filters for 'Detailed Queue Statistics' and 'Team Queue General Statistics'
Improved/Updated
- More reliable prompt saving
- Better contact search in Recents
- Updated 3C1B Telekom template
- Improved translations
Fixed
- Missing queue/ring group info on Live Chat calls
- Crash related to reporting of complex attendant transfers.
- MongoDB issues affecting call logs
- Fixed exceptions when optimizing large databases
- Resolved exceptions related to invalid prompts
- Resolved exceptions caused by the prompt folder
Removed
- Amazon Chime (service discontinued by Amazon)
- SNOM D812/D815 router features (hardware limitations)
To see all improvements and changes, view the complete changelog.
How to Get Update 6 RC3
From the Admin Console click on the latest update: "New 20.0 Update 6 RC3"
For 4SC and 8SC commercial licenses hosted by 3CX, as well as NFR and trial systems, the update installs automatically.
Post your feedback in our dedicated Partner or Customer Forums. Follow us on X and LinkedIn to stay up-to-date on further developments.









 Copyright © 2026